-
Products
- Lab Instruments
-
Lab Meters and Probes
- Chemistries, Reagents, and Standards
-
Online Analyzers
Ammonium Analysers Ammonia Monochloramine Analyzers Chlorine Analyzers
- CL17sc
- CL10sc Amperometric
- Ultra Low Range CL17sc Colorimetric Chlorine Analyser
- RMC Disinfection Panel
EZ Series Analysers- Iron
- Aluminium
- Manganese
- Phosphate
- Chloride
- Cyanide
- Fluoride
- Sulphate
- Sulphide
- Arsenic
- Chromium
- Copper
- Nickel
- Zinc
- Ammonium
- Total Nitrogen
- COD
- Phenol
- Volatile Fatty Acids
- Alkalinity
- ATP
- Hardness
- Toxicity
- Sample Preconditioning
- Boron
- Colour
- Nitrate
- Nitrite
- Silica
- Hydrogen Peroxide
- EZ Series Reagents
- EZ Series Accessories
- EZ sc Series Additional Analyzers
- EZ sc Series Inorganics
- EZ sc Series Metals
- EZ sc Series Nutrients
- Flow and Collections
-
Online Sensors and Controllers
Digital Controllers (Transmitters) Ammonium SensorspH & ORP Sensors
- 12mm pH/ORP
- 8362 sc High Purity
- Combination pH/ORP
- Differential pH
- Digital Differential ORP
- Digital Differential pH
- LCP ORP
- LCP pH
Conductivity Sensors- 3400 Analogue Contacting
- 3400 Digital Contacting
- 3700 Analogue Inductive
- 3700 Digital Inductive
- 9523 Cation Conductivity
- Samplers
- Claros Water Intelligence System
- Test Kits & Strips
-
Microbiology
Accessories and Chemicals Dehydrated MediaLabware
- Accessories
- Funnels, Pumps & Manifolds
- Microbiology Filters
- Petri Dishes & Accessories
- Sampling Bags
- Vials, Tubes, Bottles & Racks
-
Lab Equipment and Supply
Apparatus
- Brushes
- Clamps, Rings & Stands
- Crucibles
- Crucibles & Casseroles
- Dispensers & Droppers
- Grab Samplers
- Hotplates and Stirrers
- Oil and Grease
- Other Apparatus
- Pipet Aids
- Pipettes
- Racks
- Stir Bars
- Tubing
- Weighing Accessories
General Lab Consumables Glassware/PlasticwareInstruments Safety Equipment - Industrial UV
- Electrochemistry
- Parameters
- Industries
- Support
- Service
- e-Shop
- Brands
Login


Turbidity 101: What It Is, And Why It Is So Important
Request Info
ARTICLE
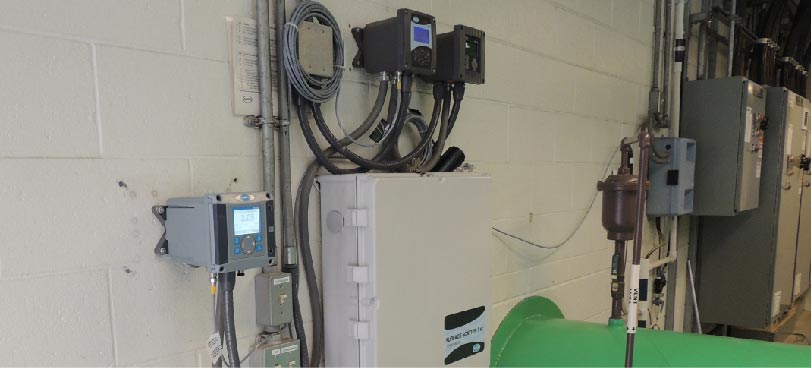
Image credit: “raw water turbidity,” Eric Shea © 2013, used under an Attribution 2.0 Generic license: https://creativecommons.org/licenses/by/2.0/
Turbidity, a measure of the cloudiness or haziness of a fluid, was originally intended as a qualitative measure of the aesthetics of drinking water. It is not a measure of actual particles in the water; it measures how much those particles affect light being transmitted through the water, or how that light reflects off particles in the water. Today’s turbidity designs and methods have been regimented in an attempt to bring quantitative consistency to the measurement for both aesthetic and pathogenic qualities of drinking water.
A Brief History Of Turbidity
The first formal measure of water turbidity (circa 1900) was called the Jackson Candle Method (Figure 1). It was essentially a vertical glass tube mounted over a candle. The scale on the tube was calibrated using dilutions of a standard reference solution comprising 1,000 parts per million (ppm) of diatomaceous earth (silica) in distilled water. The calibrated units of measure on the tube were called Jackson Turbidity Units (JTU). Sample water was poured into the tube until the distinct image of the candle flame was no longer visible to the human eye when viewed from straight above. The depth of water in the tube at that point corresponded to a distinct JTU reading on the scale of the tube. Compared to today’s instruments and methods, that original method was a relatively crude measure of turbidity that could result in inconsistencies due to differences in the viewer’s eyesight and the candle used.
In 1926, Kingsbury, Clark, Williams, and Post developed a new standard reference solution (formazin polymer) that was easier to formulate. It provided greaterconsistency than Jackson’s diatomaceous earth reference standard, which could vary according to the material source. Formazin also does a good job of replicating the particulates and turbidity typically experienced in drinking water applications. One advantage of formazin is that, even though not all of the polymer chains are of an identical size, it produces a very regular response every time it is synthesized. The formazin standard was a major step toward standardizing turbidity testing. It is still in use today, while other turbidimetry components — such as light sources and light detectors — have been refined to eliminate the variables of candle light and human eyesight.
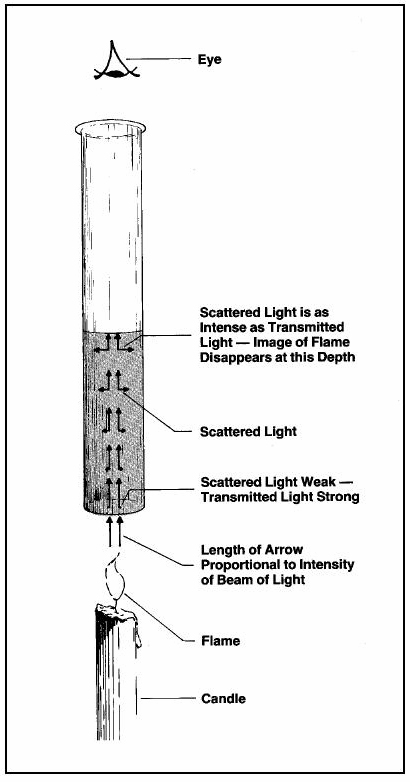
Figure 1. The original Jackson Candle Turbidimeter was based on the amount of light transmitted from a candle through a column of water.
Turbidity’s Role In Today’s Drinking Water Treatment
The main reason for measuring turbidity in drinking water is to ensure the best job of eliminating pathogens such as Giardia lamblia cysts and Cryptosporidium parvum oocysts — two of the most problematic waterborne diseases in U.S. water systems. Giardia cysts range in size from 8 to 13 microns, and the growth stage can range from 10 to 20 microns. Smaller Cryptosporidium parvum oocysts — the pathogen that most frequently affects humans — are approximately 5.0 microns x 4.5 microns.
The one event that highlighted the relevance of turbidity as a potential indicator of those problems in drinking water was the 1993 cryptosporidiosis outbreak in Milwaukee. Turbidity was the one measurement that tracked in proportion to the outbreak, leading to the realization that turbidity could be used to monitor for that very dangerous pathogen.
The value of the turbidity reading is not that it can tell specifically how many pathogens a sample might contain, but that it tells relatively how much or how little of any reflective particles are affecting the clarity of the sample, even if they are undetectable with the human eye.
Turbidity measurements are normally taken from multiple locations in a water treatment plant (WTP):
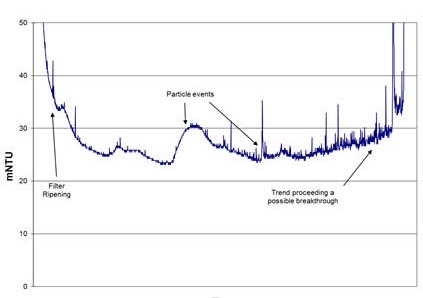
Figure 2. Continuous turbidity monitoring of a water stream after filtration makes it easy to spot filter breakthrough events or to observe steadily deteriorating trends that might indicate a membrane breakthrough.
- Source Water Intake
Source water turbidity readings can provide a good idea of pre- filtration treatment requirements (e.g., flocculation, coagulation, etc.) that can prevent overloading filters. They are of particular value for WTPs that use surface water or blended water sources where quality and turbidity can vary widely. - Pre-Filtration
Turbidity is measured pre-filtration to verify the effectiveness of the coagulation, flocculation, and clarification processes. Being able to compare pre- and post- filtration turbidity monitoring provides an indication of the effectiveness of the filtration. - Post-Filtration
Turbidity monitoring of individual and combined filter effluents is required for regulatory compliance. Measurements are made to ensure that pathogens have not made it through the WTP’s conventional and/or membrane filtration systems. Ideally, this is a continuous process that enables plant operators to react to potential upset conditions quickly (Figure 2) and maintain compliance. Monitoring separate filtering streams or membrane banks before the streams are recombined also helps optimize filter maintenance and cleaning steps by documenting declining performance or failures stream by stream. Turbidimeters are also used to read the clarity of backwash water to avoid running backwash procedures any longer than necessary. - Final Plant Effluent
Additional turbidity readings can also be taken at the point where water enters the water distribution system. This can be particularly important when water treatment and water distribution are handled by separate organizations. Additional turbidity readings might also be taken at multiple other points in the distribution network to monitor any changes in water quality as it flows through the system.
Turbidimeters Vs. Nephelometers
While the characteristic of turbidity is still used as a measure of water clarity today, the current process used in drinking water post-filtration turbidity testing is called nephelometry — from the Greek word nephélē, meaning cloud. The instrument used to measure it is a specific turbidimeter design called a nephelometer (Figure 3).
A nephelometer measures the amount of light reflected by the water sample at a 90-degree angle. This reflected light sampling minimizes the effect of variables such as particle size and color, making it sensitive enough to measure the lowest turbidity values in filter effluent. The U.S. EPA published its original Method 180.1 Determination of Turbidity By Nephelometry document in 1993, and that has served as the reference for approval of subsequent methodologies based on advancements in the measurement technique.
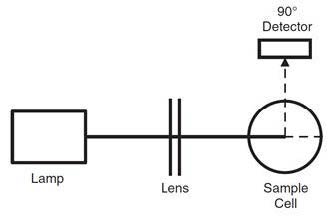
Figure 3. The basic nephelometer design used for drinking water compliance measures light reflected off particles in the water, as detected at a 90-degree angle from the original light source.
For compliance purposes, the combined effluent from all filter streams must be < 0.3 nephelometric turbidity units (NTUs) in 95 percent of the samples, and never over 1 NTU per the EPA’s Long Term 1 Enhanced Surface Water Treatment Rule. Cryptosporidium treatment credits can be claimed if individual and/or combined filter effluents are maintained <0.15 NTU. The difference between a 0.3 NTU reading and a 1.0 NTU reading is barely perceptible to the human eye but could be a big difference in terms of pathogens.
Other Turbidity Instrumentation Considerations
In addition to nephelometers used to document drinking water compliance, other types of turbidimeters are available for specialized applications.
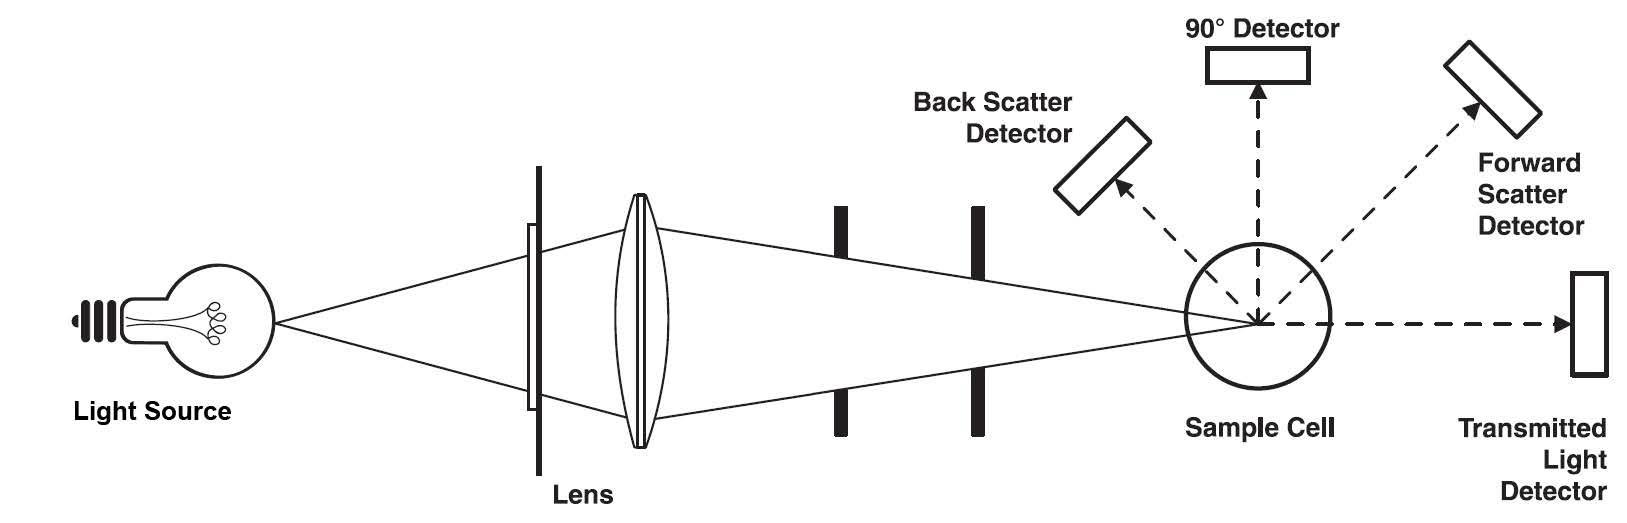
Figure 4. A ratio turbidimeter design measuring transmitted light at 180° and reflected light at 90°, at 70° (forward scatter), and at 135° (backward scatter) compares the various readings to account for various types of particle interference in turbid and colored samples.
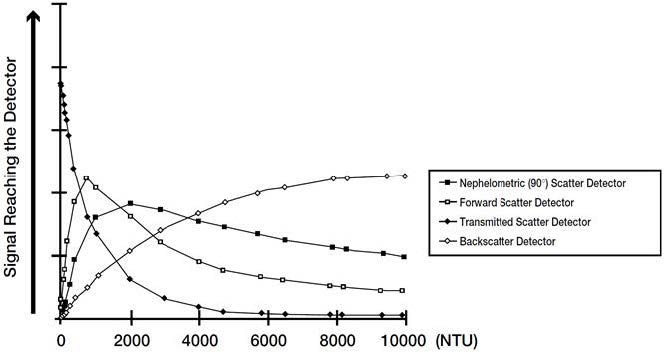
Figure 5. Nephelometric performance is linear at low turbidities, then changes as it approaches higher turbidities. Ratio turbidimeters measure four angles of detection simultaneously and calculate the resulting reading values to produce accurate measurements throughout a much larger range of turbidity.
Non-contact nephelometers, which use non-contact sensors to read light reflected by particulates in the water, are a good choice for reading turbidity in raw water samples that can get very turbid and quickly foul a sensor. This is especially useful for testing source water from rivers affected by turbidity (due to rain and farm runoff) in order to adjust flocculation or coagulation treatments to remove contaminants before water goes through the filtration process.
For wastewter-ype applications with extremely high turbidity or extreme swings in turbidity ranges, there is another type of turbidimeter called a ratio turbidimeter (Figure 4). This design measures light transmitted through the sample as well as light reflected at various angles — 90 degrees, 135 degrees (forward scatter), and 70 degrees (backscatter). The unit then calculates turbidity based on differences in the readings among those four sensors (Figure 5). This style of turbidimeter can handle an extremely wide range of turbidities from 0.1 NTU through 10,000 NTU.
Process Line Vs. Laboratory Instruments
Due to cost constraints, some smaller WTPs might use only one or two laboratory instruments for turbidity sampling. Larger WTPs will tend to have multiple on-line nephelometers for continuous process monitoring and use laboratory instruments for backup and as a check on process readings. Care must be exercised when comparing lab and process measurements, unless the sensing technology in both is identical. Differences in measuring methods can introduce potential variables between the two readings. Physical changes in samples — such as particle settling — can occur over time while samples are being transported from the process line to the lab. Also, mishandling of glass or plastic sample cells can lead to scratches or smudges that can disturb light transmission and skew readings.
Want more information on turbidity?
Visit: https://au.hach.com/industries/drinking-water/turbidity